Главная
Клипы
Новинки
Тренды
Популярные
Лайки
Комментарии
Все категории
Музыка
Фильмы
Видеоигры
Транспорт
Животные
Спорт
Путешествия
Люди и блоги
Юмор
Развлечения
Политика
Хобби
Образование
Наука
Организации
Найти
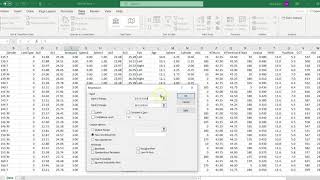
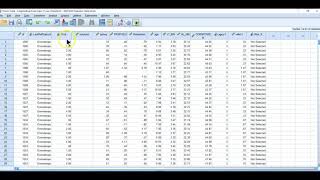
Load csv file and perform descript stats in SPSS
John Hayes
598 подписчиков
Скачать
164 видео с канала:
John Hayes
Load csv file and perform descript stats in SPSS
Скачать
Load and Run an R program
Скачать
zotfile
Скачать
Aggregating Data in SPSS
Скачать
GLM Least squares
Скачать
t test and effect size
Скачать
SPSS Data Cleaning
Скачать
r setup demo
Скачать
SD Lecture Example
Скачать
EBO Introduction
Скачать
Mixed Homework 2
Скачать
Setting up a balanced incomplete block design
Скачать
GLM Repeated Measures
Скачать
Measuring change ANCOVA SPSS
Скачать
Simulating ANCOVA with Excel
Скачать
Excel correl, intercept, slope
Скачать
Sample Size
Скачать
Excel example worksheet t test
Скачать
Excel example worksheet
Скачать
Introduction to statistics Midterm 1
Скачать
Part 2 SD and distributions
Скачать
Part 1. Standard Deviation and distributions demo
Скачать
Regression Homework
Скачать
Hack your study environment with blue light
Скачать
Cite a reference
Скачать
Why is outdoor activity protective
Скачать
Risk of glaucoma
Скачать
Likert and Rasch Scales
Скачать
Correlation and Regression
Скачать
Hypothesis Testing
Скачать
Standard Error and Confidence Interval
Скачать
Standard Deviation and Standard Interpretations
Скачать
Study Design February 2020
Скачать
Write an evidence based paper
Скачать
Accessing the complete article through Zotero
Скачать
Save a webpage to Zotero
Скачать
2 Searching the literature with Google Scholar
Скачать
Outliers
Скачать
Cox Regression
Скачать
Kaplan Meier Survival analysis example
Скачать
Practice Effect size in Zotero articles
Скачать
Sample size myopia trial axial length
Скачать
Chi Square and adjusted standardized Residual
Скачать
Multiple logistic regression predicting good fit
Скачать
Scale cutoff using logistic regression
Скачать
Effect size and confidence Interval
Скачать
SPSS Mixed one way
Скачать
Mixed comparing means
Скачать
GLM v Mixed
Скачать
CovarianceHomework ENCODING
Скачать
t test and oneway ANOVA
Скачать
Normal dist and logMAR conversion
Скачать
Intro to SPSS
Скачать
Design screening
Скачать
Odds ratio and relative risk
Скачать
Regression and correlation
Скачать
Measurement
Скачать
Hypothsis testing
Скачать
variability and axxuracy
Скачать
Distribtuion quiz q 4
Скачать
Distribution Lecture 1
Скачать
Distribution Lecture 2
Скачать
Study Design
Скачать
Zotero example
Скачать
Searching the literature
Скачать
Intro tto EB
Скачать
Risk of burning up. Analyzing Risk with SPSS
Скачать
Factor Analysis exmple SPSS
Скачать
Statistical significance
Скачать
General Linear Model with Between and within Confidence interval
Скачать
2way ANOVA with Proc Mixed
Скачать
Post hoc comparisons GLM v Mixed
Скачать
SPSS Proc Mixed
Скачать
One way repeated measures ANOVA + Sphericity
Скачать
Calculating Estimated means from te ANCOVA parameter estimates
Скачать
Mixed model anova repeated measures and between subjects
Скачать
Confidence interval for 84% CI
Скачать
T simulation explained
Скачать
Paired and independent t test + Effect Siz
Скачать
Sample size sstimation Worksheet
Скачать
Zscore Error Bars
Скачать
Z score bar chart ENCODING
Скачать
Survey Lecture 5 Implementation
Скачать
Survey Lecure 5 Examples
Скачать
Survey Lecture 1 Introduction
Скачать
Survey Lecture 3 Social Exchange Theory
Скачать
Survey Lecture 2 Error Copy
Скачать
Survey Lecture 4 Pre test Copy
Скачать
Propensity split by eye and age Part 1
Скачать
Refworks demo
Скачать
Factor Analysis Part 2
Скачать
Factor Analysis Part 1
Скачать
Computer quantifying lipofuscin
Скачать
Manually quantifying lipofuscin
Скачать
Mixed model example
Скачать
Reading the Sample Size Table
Скачать
Covariance structure in Mixed Models
Скачать
Logistic Regress 1
Скачать
Multiple Logistic Regression
Скачать
Chow regression and definition of spherical groups
Скачать
Multiple regression and multicollinearity
Скачать
Chi Square
Скачать
2 way ANCOVA
Скачать
One way ANOVA
Скачать
ttests
Скачать
Google Scholar Settings
Скачать
Bar Graphs with standard error bars
Скачать
SPSS Transform compute Data Select Split
Скачать
Checking for normality
Скачать
Measurement Theory
Скачать
Epidemiology Part 2
Скачать
Epidemiology Part 1
Скачать
Searching and loading references into a database
Скачать
Insert citations into a document
Скачать
Adding to your database with Google Scholar
Скачать
SPSS t test and graphing means and error bars with Excel
Скачать
Recording #70
Скачать
Plotting the probability of an event using logistic regression in SPSS and Excel
Скачать
What is likelihood
Скачать
Check for goodness of balancing propensity values
Скачать
Logistic Regression SPSS
Скачать
Defining a cutoff with logistic regression
Скачать
Odds ratio and relative risk excel
Скачать
Sensitivity Specificity Excel
Скачать
Standardized Residuals
Скачать
Chi square SPSS
Скачать
Crosstabs in SPSS
Скачать
Repeated Measures ANOVA Least Squares
Скачать
ANOVA Repeated Measures Maximum Likelihood
Скачать
Calculated effect size with Proc Mixed ANOVA
Скачать
Finding the best covariance matrix in Proc Mixed
Скачать
ANCOVA
Скачать
ANCOVA Assumptions
Скачать
Recoding variables in SPSS
Скачать
Oneway ANOVA with SPSS
Скачать
ANOVA Interaction
Скачать
Two way factorial ANOVA in SPSS
Скачать
Compute correlation in Excel
Скачать
Computing a simple linear regression with SPSS
Скачать
Plotting residuals in SPSS
Скачать
Multicolinearity
Скачать
Drawing a simple graph in SPSS for regression
Скачать
Computing multiple regression with SPSS
Скачать
Range Restriction
Скачать
Defining Covariance
Скачать
Defining R squared
Скачать
Computing a regression line in Excel
Скачать
Evaluating residuals in simple linear regression using Excel
Скачать
Excel simulation of an independent t test
Скачать
Null hypothesis and p value
Скачать
Computing a paired t test with SPSS
Скачать
Creating random samples for simulation in Excel
Скачать
Excel Simulation Standard Error and Confidence Interval
Скачать
Independent t test in SPSS
Скачать
Calculating a t test in Excel
Скачать
SPSS aggregate
Скачать
Distributions Random R examples uniform normal lognormal
Скачать
Excel Example Descriptive statistics functions mean, sd, sem, ci, median
Скачать
Standard error is the standard deviation of a sampling distribution
Скачать
Normal Distribution
Скачать
Intro to SPSS Descriptive Frequencies
Скачать
SPSS TransformCompute
Скачать
Excel example of creating frequency distributions using =FREQUENCY
Скачать
SPSS DataSplit DataSelect AnalyzeDescriptiveCrosstabs
Скачать
Канал: John Hayes
Load csv file and perform descript stats in SPSS
Скачать
Load and Run an R program
Скачать
zotfile
Скачать
Aggregating Data in SPSS
Скачать
GLM Least squares
Скачать
t test and effect size
Скачать
SPSS Data Cleaning
Скачать
r setup demo
Скачать
SD Lecture Example
Скачать
EBO Introduction
Скачать
Mixed Homework 2
Скачать
Setting up a balanced incomplete block design
Скачать
GLM Repeated Measures
Скачать
Measuring change ANCOVA SPSS
Скачать
Simulating ANCOVA with Excel
Скачать
Excel correl, intercept, slope
Скачать
Sample Size
Скачать
Excel example worksheet t test
Скачать
Excel example worksheet
Скачать
Introduction to statistics Midterm 1
Скачать
Part 2 SD and distributions
Скачать
Part 1. Standard Deviation and distributions demo
Скачать
Regression Homework
Скачать
Hack your study environment with blue light
Скачать
Cite a reference
Скачать
Why is outdoor activity protective
Скачать
Risk of glaucoma
Скачать
Likert and Rasch Scales
Скачать
Correlation and Regression
Скачать
Hypothesis Testing
Скачать
Standard Error and Confidence Interval
Скачать
Standard Deviation and Standard Interpretations
Скачать
Study Design February 2020
Скачать
Write an evidence based paper
Скачать
Accessing the complete article through Zotero
Скачать
Save a webpage to Zotero
Скачать
2 Searching the literature with Google Scholar
Скачать
Outliers
Скачать
Cox Regression
Скачать
Kaplan Meier Survival analysis example
Скачать
Practice Effect size in Zotero articles
Скачать
Sample size myopia trial axial length
Скачать
Chi Square and adjusted standardized Residual
Скачать
Multiple logistic regression predicting good fit
Скачать
Scale cutoff using logistic regression
Скачать
Effect size and confidence Interval
Скачать
SPSS Mixed one way
Скачать
Mixed comparing means
Скачать
GLM v Mixed
Скачать
CovarianceHomework ENCODING
Скачать
t test and oneway ANOVA
Скачать
Normal dist and logMAR conversion
Скачать
Intro to SPSS
Скачать
Design screening
Скачать
Odds ratio and relative risk
Скачать
Regression and correlation
Скачать
Measurement
Скачать
Hypothsis testing
Скачать
variability and axxuracy
Скачать
Distribtuion quiz q 4
Скачать
Distribution Lecture 1
Скачать
Distribution Lecture 2
Скачать
Study Design
Скачать
Zotero example
Скачать
Searching the literature
Скачать
Intro tto EB
Скачать
Risk of burning up. Analyzing Risk with SPSS
Скачать
Factor Analysis exmple SPSS
Скачать
Statistical significance
Скачать
General Linear Model with Between and within Confidence interval
Скачать
2way ANOVA with Proc Mixed
Скачать
Post hoc comparisons GLM v Mixed
Скачать
SPSS Proc Mixed
Скачать
One way repeated measures ANOVA + Sphericity
Скачать
Calculating Estimated means from te ANCOVA parameter estimates
Скачать
Mixed model anova repeated measures and between subjects
Скачать
Confidence interval for 84% CI
Скачать
T simulation explained
Скачать
Paired and independent t test + Effect Siz
Скачать
Sample size sstimation Worksheet
Скачать
Zscore Error Bars
Скачать
Z score bar chart ENCODING
Скачать
Survey Lecture 5 Implementation
Скачать
Survey Lecure 5 Examples
Скачать
Survey Lecture 1 Introduction
Скачать
Survey Lecture 3 Social Exchange Theory
Скачать
Survey Lecture 2 Error Copy
Скачать
Survey Lecture 4 Pre test Copy
Скачать
Propensity split by eye and age Part 1
Скачать
Refworks demo
Скачать
Factor Analysis Part 2
Скачать
Factor Analysis Part 1
Скачать
Computer quantifying lipofuscin
Скачать
Manually quantifying lipofuscin
Скачать
Mixed model example
Скачать
Reading the Sample Size Table
Скачать
Covariance structure in Mixed Models
Скачать
Logistic Regress 1
Скачать
Multiple Logistic Regression
Скачать
Chow regression and definition of spherical groups
Скачать
Multiple regression and multicollinearity
Скачать
Chi Square
Скачать
2 way ANCOVA
Скачать
One way ANOVA
Скачать
ttests
Скачать
Google Scholar Settings
Скачать
Bar Graphs with standard error bars
Скачать
SPSS Transform compute Data Select Split
Скачать
Checking for normality
Скачать
Measurement Theory
Скачать
Epidemiology Part 2
Скачать
Epidemiology Part 1
Скачать
Searching and loading references into a database
Скачать
Insert citations into a document
Скачать
Adding to your database with Google Scholar
Скачать
SPSS t test and graphing means and error bars with Excel
Скачать
Recording #70
Скачать
Plotting the probability of an event using logistic regression in SPSS and Excel
Скачать
What is likelihood
Скачать
Check for goodness of balancing propensity values
Скачать
Logistic Regression SPSS
Скачать
Defining a cutoff with logistic regression
Скачать
Odds ratio and relative risk excel
Скачать
Sensitivity Specificity Excel
Скачать
Standardized Residuals
Скачать
Chi square SPSS
Скачать
Crosstabs in SPSS
Скачать
Repeated Measures ANOVA Least Squares
Скачать
ANOVA Repeated Measures Maximum Likelihood
Скачать
Calculated effect size with Proc Mixed ANOVA
Скачать
Finding the best covariance matrix in Proc Mixed
Скачать
ANCOVA
Скачать
ANCOVA Assumptions
Скачать
Recoding variables in SPSS
Скачать
Oneway ANOVA with SPSS
Скачать
ANOVA Interaction
Скачать
Two way factorial ANOVA in SPSS
Скачать
Compute correlation in Excel
Скачать
Computing a simple linear regression with SPSS
Скачать
Plotting residuals in SPSS
Скачать
Multicolinearity
Скачать
Drawing a simple graph in SPSS for regression
Скачать
Computing multiple regression with SPSS
Скачать
Range Restriction
Скачать
Defining Covariance
Скачать
Defining R squared
Скачать
Computing a regression line in Excel
Скачать
Evaluating residuals in simple linear regression using Excel
Скачать
Excel simulation of an independent t test
Скачать
Null hypothesis and p value
Скачать
Computing a paired t test with SPSS
Скачать
Creating random samples for simulation in Excel
Скачать
Excel Simulation Standard Error and Confidence Interval
Скачать
Independent t test in SPSS
Скачать
Calculating a t test in Excel
Скачать
SPSS aggregate
Скачать
Distributions Random R examples uniform normal lognormal
Скачать
Excel Example Descriptive statistics functions mean, sd, sem, ci, median
Скачать
Standard error is the standard deviation of a sampling distribution
Скачать
Normal Distribution
Скачать
Intro to SPSS Descriptive Frequencies
Скачать
SPSS TransformCompute
Скачать
Excel example of creating frequency distributions using =FREQUENCY
Скачать
SPSS DataSplit DataSelect AnalyzeDescriptiveCrosstabs
Скачать