Power BI - add search to slicer #powerbi #powerbitips Data For Knowledge 10,8 тыс. подписчиков Скачать
Power BI - Text filter visual (Search box) to help search for words appearing in a specified field Скачать
R programming - how to create small multiples diagram using facet_wrap and facet_grid from ggplot2 Скачать
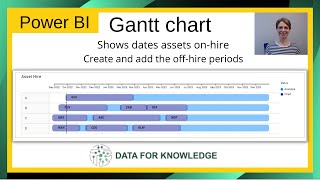
Power BI - Gantt chart showing asset hire periods. How to create off-hire periods in gantt chart. Скачать
How to create line chart with points using ggplot2 & plotly - includes data pivot - R Project Скачать
R Project - how to create bar chart (ggplot2) from spreadsheet-includes data pivot & remove a column Скачать
Power BI project - How to create image grids to explore stunning images of art sourced from Wikidata Скачать
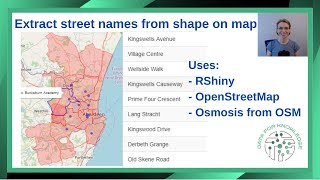
Using OpenStreetMap osmosis extract street names from polygon on map for display in RShiny table Скачать
RShiny project - Plot polygons from GeoJSON file to leaflet map and plot circles from excel file Скачать
In R Shiny create leaflet map, add layer of rectangle shapes, toggle layer on and off - example Скачать
Power BI - How to navigate line diagrams (line charts) - Introduction for a consumer of a report Скачать
Using R code, merge 3 csv files using left joins in an R Script - follow along using open data Скачать
Map direction of ship travel using AIS data in R Shiny app on a Leaflet map - follow along example Скачать
Power BI - Append - project example to join datasets - uses Open Data and an simple API request Скачать
Power BI - Create dynamic titles/headers on diagrams/pages - Date, single selection, multi-selection Скачать