How to resolve duplicate-record issue in Power BI for Likert Scale Chart? | Power BI Custom Visual ChartExpo 1,61 тыс. подписчиков Скачать
How to resolve duplicate-record issue in Power BI for Likert Scale Chart? | Power BI Custom Visual Скачать
Sankey Diagram – Tesla Q4 FY23 Income Statement in Excel | Sankey Chart in Excel | Financial Charts Скачать
Sankey Diagram – Amazon Q4 FY23 Income Statement | Sankey Chart in Excel | Financial Statements Скачать
How to install and buy ChartExpo domain subscription for Excel? | Excel Data Visualization Add-in Скачать
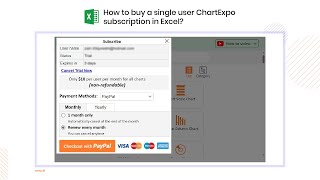
How to buy ChartExpo single user subscription for Excel? | Data Visualization Tool | Excel Add-in Скачать
How to install and buy ChartExpo subscription for Google Sheets domain users? | Google Sheets Add-on Скачать
How to create a Clustered Stacked Bar Chart in Excel? | Detailed Comparison | Space Efficiency Скачать
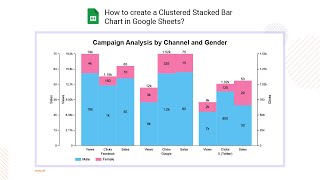
How to create a Clustered Stacked Bar Chart in Google Sheets? | Detail Comparison | Space Efficiency Скачать
Sankey Diagram – Meta Q4 FY23 Income Statement in Excel | Excel Sankey Chart | Financial Statements Скачать
Sankey Diagram – Alphabet Q4 FY23 Income Statement | Sankey Chart in Excel | Financial Statements Скачать
Sankey Diagram – NVIDIA Q2 FY24 Income Statement | Sankey Diagram in Power BI | Financial Statements Скачать
How to create a Mosaic Plot (aka Mekko) in Google Sheets? | Marimekko Chart | Stacked Spinogram Скачать
Sankey Diagram – Microsoft Q4 FY23 Income Statement | Sankey Chart in Excel | Financial Statements Скачать
How to create a Radar Chart in Excel? | Web Chart | Spider Chart | Star Plot | Cobweb or Polar Chart Скачать
How to create a Waterfall Chart (Bridge Chart) in Excel? | Stacked Waterfall Chart | Cascade Chart Скачать
How to create a Radar Chart in Google Sheets? | Web Chart | Spider Chart | Polar Chart | Polygon Скачать
How to create a Box and Whisker Column Chart in Google Sheets? | Box Plot | Statistical Charts Скачать
How to create a Stacked Bar Chart in Excel? | Excel Charts | Comparison Chart | Horizontal Bar Chart Скачать
How to create Circular Charts in Excel in a FEW minutes | Circular Org Chart you NEVER seen before Скачать
How to create a Box and Whisker Column Chart in Excel? | Box Plot Example | Box and Whisker Plot Скачать
How to visualize Market Share Analysis in Google Sheets using Comparison Bar Chart? | Ribbon Chart Скачать
How to create an Overlapping Bar Chart in Google Sheets? | Actual vs Target Chart in Google Sheets Скачать
How to create an Overlapping Bar Chart in Excel? | Two Bars Comparison Chart | Actual vs Target Скачать
How to visualize Market Share Analysis in Excel using Comparison Bar Chart | Competitor Analysis Скачать
Apple’s Income Statement FY2023 Four Quarters | Apple Financial Statements 2023 | Apple Reports Скачать
Microsoft’s Income Statement FY2023 Four Quarters | Microsoft Financial Statements | Annual Report Скачать
How to create a Heatmap in Excel? | Exploratory Data Analysis | Matrix Visualization | Big Data Viz Скачать
ChartExpo - Data Visualization add-in for Microsoft Excel & Office 365 | Excel Add-In | Chart Maker Скачать
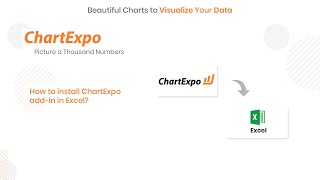
How to install ChartExpo add-in in Excel and Microsoft Office 365? | Excel Add-In | Excel Charts Скачать
How to install ChartExpo add-on in Google Sheets? | Google Sheets Charts | Google Sheets Add-on Скачать
How to create a Histogram in Excel? | Data Distribution | Frequency Distribution | Histogram Example Скачать
Sankey Diagram – Apple Q4 FY23 Income Statement | Sankey Chart in Excel | Image Financial Statements Скачать
How you can access already saved chart from “My chart” menu in ChartExpo for Google Sheets add-on? Скачать
How to create a Process Flow – Order Fulfillment Funnel Chart in Excel? | Pyramid Chart | Charts Скачать
How to visualize Risk Management Analysis in reports effectively? | Risk Assessment | Risk Analysis Скачать
How Freeze Nodes property influences vertical nodes arrangement in the Sankey Diagram for Power BI? Скачать
How the Force Precision property affects percentage values in a Sankey chart for Google Sheets? Скачать
The Art of Customer Surveys - Likert Scale Chart Visual for Customer Surveys in Microsoft Power BI Скачать
How to create Histogram in Google Sheets? | Frequency Distribution | Continuous Data | Discrete Data Скачать
How the Ignore Missing Data property affects the node links in Sankey chart for Google Sheets? Скачать
How to make an Expense Report Template in Power BI using Sankey Diagram? | Power BI Visualization Скачать
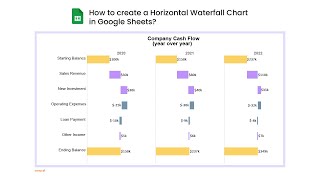
How to create a Horizontal Waterfall Chart in Excel? | Cascade Chart | Bridge Chart | Excel Charts Скачать
How to create a Digital Marketing Funnel in Excel? | Funnel Chart | Pyramid Chart | Funnel Diagram Скачать
How the Ignore Missing Data property affects the node links in Sankey chart for Microsoft Excel? Скачать
How the Force Precision property affects percentage values in Sankey chart for Microsoft Excel? Скачать
How to make a Gauge Chart in Google Sheets? | Speedometer Chart | Progress Chart | Dial chart Скачать
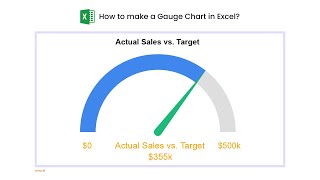
How to make a Gauge Chart in Excel? | Excel Speedometer Chart | Needle Chart | Progress Chart Скачать
How the Ignore Missing Data property affects the node links in Sankey diagram in Microsoft Power BI? Скачать
How the Force Precision property affects percentage values in Sankey diagram for Microsoft Power BI? Скачать
How to create a Horizontal Waterfall Chart in Google Sheets? | Bridge Graph | Waterfall Diagram Скачать
What is Competitive Analysis in Marketing? | Business KPIs & KPIs | Spider Chart in Google Sheets Скачать
How to create a Stacked Waterfall Chart in Excel? | Income Statement | Revenue Bridge Chart | P&L Скачать
How to create an Expansion Funnel Chart in Excel? | Marketing Funnel | Sales and Purchase Funnel Скачать
How do top 10 product categories compare in terms of YoY sales in Power BI? | Comparative Analysis Скачать
How to create a Progress Circle Chart in Google Sheets | Gauge Charts | Circle Charts | Donut Chart Скачать
How to make a Pyramid Chart in Google Sheets | Pyramid Diagram | Funnel Chart | Triangle Diagrams Скачать
How to create Likert Scale Chart in Excel with 3 different data formats | Survey chart | Survey Tool Скачать
How to make a Funnel Chart (aka Pyramid Chart) in Excel | Recruitment Process Flow | Lead Generation Скачать
How to create a Likert Scale Chart in Google Sheets | Survey Analysis | Survey Chart | Survey Tool Скачать
How to create Sequence Chart in Google Sheets | Visualize data to highlight rankings | Sorted Chart Скачать
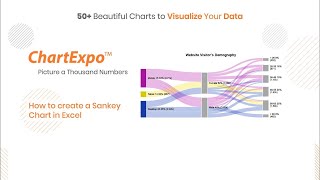
How to create a Sankey Diagram in Google Sheets | What is Sankey diagram | Sankey in Google Sheets Скачать
How to create a Likert Scale Chart in Microsoft Power BI | Power BI Custom Visuals | Survey Chart Скачать
How to analyze NPS score in Google Sheets Using CSAT Score Bar Chart | Customer Satisfaction Survey Скачать
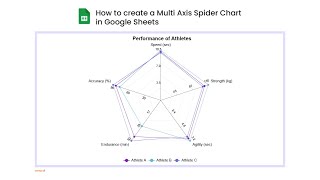
How to create a Multi Axis Spider Chart in Google Sheets | Multiple Axes Radar Chart | Web Chart Скачать
HR Management: Analyze Recruitment Process using Sankey Diagram in Power BI | HRMS - Recruiting Скачать
From Raw Data to Strategic Insights: Dynamic Survey Analysis Using Likert Scale Chart in Power BI Скачать
Waste Management: Waste generation flow using Sankey Diagram in Power BI | Plastic recycling example Скачать
How to analyze NPS & CSAT score in Excel Using CSAT Score Bar Chart | Customer Satisfaction Survey Скачать
How to cancel ChartExpo domain subscription for Excel| Data Visualization Tool | Excel Add-in Скачать
How to cancel ChartExpo single user subscription for Excel| Data Visualization Tool | Excel Add-in Скачать
Customer Feedback Survey Analysis Using Likert Scale Chart in Microsoft Power BI | Survey Report Скачать
How to create a Sequence Chart in Excel | Visualize data in a way that makes rankings more evident Скачать
How to create an Expansion Funnel Chart in Google Sheets | Shopping Behavior | Funnel Analysis Скачать
Sales Analysis Using Sankey Diagram in Microsoft Power BI | Sales Dashboard | Power BI Dashboard Скачать
How to create a Dual Axis Grouped Column Chart in Google Sheets | Compare multiple sets of data Скачать
How to create Multi Axis Spider Chart in Google Sheets | Radar Chart with Multiple Axes | Star Plot Скачать
How to create a Progress Circle Chart in Google Sheets | Gauge Charts | Circle Charts | Donut Chart Скачать
How to create Dual Axis Grouped Column Chart in Excel | Excel chart 2 Y-axes | Excel Secondary Axis Скачать
Walking in the Customer’s Shoes: Navigating the customer journey using Sankey Diagram in Power BI Скачать
How to Create an Income Statement with Sankey Diagram in Microsoft Power BI | Cash Flows Statement Скачать
How to create a Crosstab Chart in Excel | Cross-tabulation in Excel | Pivot Table | Pivot Chart Скачать
How to create a Tag Cloud Chart in Google Sheets | Text Data Visualization Techniques | Word Clouds Скачать
How to create a Grouped Dot Plot in Google Sheets | Strip Plot | Google Sheets Charts Tutorial Скачать
How to create an Area Line Chart in Excel | Charts in Excel | Area Chart | Line Chart | Double Axis Скачать
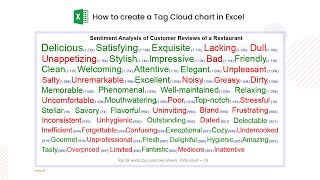
How to create Tag Cloud Chart in Excel | Tag Cloud Generator | Word Cloud Maker | Text Visualization Скачать
How to create an Area Line Chart in Google Sheets | Google Sheets Charts | Area Chart | Line Chart Скачать
How to make a Dual Axis Line Chart in Excel | Dual Y-Axis Graph | 2 Vertical Y-Axis | Secondary Axis Скачать
How to make a Dual Axis Line Chart in Google Sheets | Double Axis Line Chart | Dual Axis Chart Скачать
How to create a Multi Axis Line Chart in Google Sheets | Trend Analysis | Multivariate Analysis Скачать
How to make a Funnel Chart (aka Pyramid Chart) in Excel | Recruitment Process Flow | Lead Generation Скачать
How to make a Double Axis Line Graph and Bar Chart in Excel | Combo Chart | Linking two sets of data Скачать
How to create a Matrix Chart in Google Sheets | Bar Chart in Matrix | Multiple Bars Chart in Grid Скачать
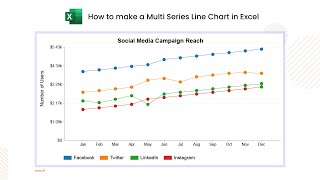
How to Make a Multi Series Line Chart in Excel | Multi-line Graph | Time Series Chart | Line Graph Скачать
How to create a Text Relationship Chart in Excel | Word Frequency Analysis | Text Analysis Chart Скачать
How to create a Clustered Bar Chart in Excel | Group Bar Chart in Excel | Bar Chart | Excel Charts Скачать
How to make a Circular Org Chart in Google Sheets | Hierarchical Org Chart | Circular Template Скачать
How to make a Pyramid Chart in Google Sheets | Pyramid Diagram | Funnel Chart | Triangle Diagrams Скачать
How to make a Dot Plot in Excel | Dot Plot Statistical Chart | Frequency Chart | Excel Chart & Graph Скачать
How to create a Clustered Column Chart in Excel | Group Column Chart in Excel | Column or Bar Chart Скачать
How to create a Scatter Plot in Excel | Dot Plot | XY Graph | Scatter Graph | Scatter Diagram Скачать
How to create a Dot Plot (ORA) Chart in Excel | Over Representation Analysis | Enrichment Analysis Скачать
How to make a Circular Org Chart in Excel | Organization Chart in 3 Minutes | Hierarchy Chart Скачать
How to do Website Survey Analysis in Excel using Likert Scale Chart | Analyze Results from a Survey Скачать
Sankey Diagram in Microsoft Power BI | Features Tutorial with (Cross-highlighting & Cross-filtering) Скачать
How to make Product Comparison Sales Analysis Template in Google Sheets | Comparison Chart Template Скачать
How to do Customer Complaints Analysis in Excel using Sankey Diagram | Issue Tracker Template Скачать
How to do Consumer Behavior Analysis in Excel using Sankey Diagram | Customer Behavior Analysis Скачать
Lead Generation Process Flow: Visualize Lead Flow with Sankey Diagram | What is Lead Generation? Скачать
Project Status Report: How to Make Simple Project Progress Report Template in Excel | Sankey Diagram Скачать
How to do Website Traffic Analysis in Excel | Website Analysis Report | Web Traffic Analysis Tool Скачать
Executive Summary Example Charts in Excel | Present Summarize Data with Confidence | Excel Charts Скачать
Likert Scale Survey Example: The best way to analyze and interpret Likert Scale questionnaire Скачать
How to analyze Financial Statements in Google Sheets by using Sankey Diagram | Balance Sheet Demo Скачать
How to create an Expense Report in Google Sheets using Sankey Diagram | Expense Tracker -Track Money Скачать
How to create a Sales Pipeline Report in Google Sheets with Sankey Diagram | What is Sales Pipeline? Скачать
Visual Analysis of Data in Excel | Charts in Excel | Learn Excel Data Analytics Essential Skills Скачать
How to Analyze Product Survey Questions in Excel Using Likert Scale Chart | Likert Scale Questions Скачать
EBITDA – how to visualize financial data in Excel | Waterfall Chart in Excel | EBITDA explained Скачать
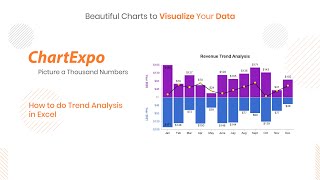
How to do Trend Analysis in Excel | Example of Trend Analysis | Advanced Excel Chart | Trend Chart Скачать
How to create a year-over-year growth chart in Excel | Dual Axis Chart | Business charts in Excel Скачать
Best Sales Graph in Google Sheets | Line and Bar Graph | Double axis| Combo Chart | Advance Chart Скачать
How to create a CSAT Score Column Chart in Excel | Customer Satisfaction Score | NPS | Excel Charts Скачать
How to create an Overlapping Bar Chart in Google Sheets | Actual vs Target Chart in Google Sheets Скачать
How to create a CSAT Score Stacked Column Chart in Google Sheets | Customer Satisfaction Score | NPS Скачать
How to create a Control Chart in Google Sheets | Statistical Process Control | Google Sheets Chart Скачать
Financial Accounting – Financial Reporting in Google Sheets using Waterfall Chart | Income Statement Скачать
What is HR Analytics? | How to do HR Analytics in Excel using Sankey Diagram | Recruitment Process Скачать
How to use Sankey Diagram for Sales Data Analysis in Excel | Interactive Excel Dashboard Tutorial Скачать
Understand a P&L in a few minutes | How to create a P&L chart in Google Sheets | Waterfall Chart Скачать
Sentiment Analysis – How to Detect and Understand Customer Feelings to Improve Customer Experience Скачать
How to do SWOT Analysis for Business in Google Sheets using Sankey Diagram | Type of Gap Analysis Скачать
How to create Waterfall Chart (Bridge Chart) in Google Sheets | Stacked Waterfall Chart | Cash Flow Скачать
Learn how to create Personal Budget Template in Excel using Sankey Diagram | Excel Charts add-in Скачать
How to create a Waterfall Chart (Bridge Chart) in Excel | Stacked Waterfall Chart | Excel Chart Скачать