Follow up Questions of describe a foreigner who speaks your native language (Hindi) very well. Param kahlon 8,42 тыс. подписчиков Скачать
Follow up Questions of describe a foreigner who speaks your native language (Hindi) very well. Скачать
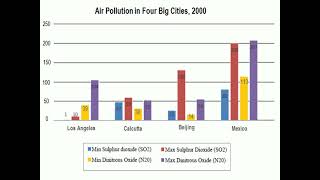
The chart below shows the average daily minimum and maximum level of two air pollutants in four big Скачать
The pie chart shows women in poverty in the United States and bar chart compares poverty rates by Скачать
The bar chart shows shares of expenditures for five major categories in the United States, Canada, Скачать
Writing task 1 The table below gives information about students studying in six departments in an Скачать
The given table illustrates the changes and difference in the proportion of full-time and part-time Скачать
The graph below shows the annual visitor spend for visitors to New Zealand from 5 countries for the Скачать
The chart shows requests for information at a tourist office in the United Kingdom from January to Скачать
Talk about a traditional object of your country or Talk about a traditional product of your country Скачать
The chart below show a percentage of five kinds of books sold bookseller between 1972 to 2012. Скачать
The chart below shows what Anthropology graduates from one university did after finishing their Скачать
The plans below show the site of a mining town in the past and redevelopment in the present day Скачать
The line chart below shows the changes that took place in three different areas of crime in New Port Скачать
The bar chart illustrates the percentage of businesses in the UK who had a social media presence Скачать
The chart below show changes in the proportion of energy produced from different resources in a Скачать
The bar charts below show the number of hours each teacher spent teaching in different schools in Скачать
Board table and pie chart illustrate populations in Australia, according to different nationalities Скачать
The line chart shows average attendance at the cinema among various age groups in the US from 2000 Скачать
The graph below shows that, the percentage of Australian exports to 4 countries from 1990 to 2012 Скачать
Follow ups of Describe a foreign person who you have heard or known that you think is interesting. Скачать
The graph below shows the percentage of 18-25 year olds in universities in four different countries Скачать
The chart below shows the average daily minimum and maximum level of two air pollutants in four big Скачать
The table below shows the percentage of the population and the types of houses they live in 3 areas Скачать
The cart below gives information about adults with education at high school level in six countries Скачать
The bar chart illustrates the number of people in the UK eating more than 5 portions of vegetables a Скачать
The plans below show the site of an airport now and how it will look after redevelopment next year. Скачать
The table below illustrates weekly consumption by age group of dairy products in a European country. Скачать
The bar graph shows the total manufacturing production in percentages Asia, Europe, and the rest of Скачать
The charts below show the changes in ownership of electrical appliances and the amount of time spent Скачать
The charts give information about two categories of TV programs watched by men and women and four Скачать
The table below shows the numbers of visitors to Ashdown Museum during the year before and the year Скачать