Plot Pie chart, squarify plot and bar chart of proportions at the start and later stage of covid Vishal Goundar 1 подписчик Скачать
Plot Pie chart, squarify plot and bar chart of proportions at the start and later stage of covid Скачать
Construct Boosting model with 500 trees using "bernoulli" distribution on two class factor values Скачать
In the random forest bagging model, compare the out of bag error rate with the predicted error rate Скачать
Plot root mean square error and the time taken for Linear, RandomForest and XGBRegressor models Скачать
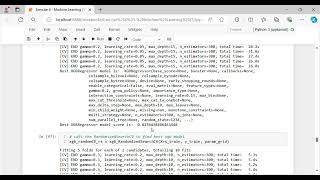
Search for the best parameters from RandomizedSearchCV and GridSearchCV and fit XGBRegressor model Скачать
Find best parameters using RandomizedSearchCV then GridSearchCV and develop Linear Regression model Скачать
Perform the normalization of the dataset to provide a standardized input to the machine learning. Скачать
Feature engineering of creating new variables, and splitting data set into train set and test set Скачать
Visualize relationship of geospatial attributes (Longitude, Latitude) with the median house price Скачать
Dendrogram of the hierarchical clustering results using complete and the single linkage methods. Скачать
Dendrogram of the hierarchical clustering results using the complete and the single linkage method Скачать
Find mixture-based clustering using varying variance subfamily of multivariate normal mixtures Скачать
Find the two most important variables in predicting a mobile price for the best learning method Скачать