This video presents one of the well testing tools: the log-log plot, also commonly known as derivative plot. This is a very powerful tool that allows us to visualize the flow behaviour around the well, spot the radial flow regime and other flow regimes, detect the presence of boundaries, etc... This presentation should give you a practical understanding of this tool.
All at [ Ссылка ]
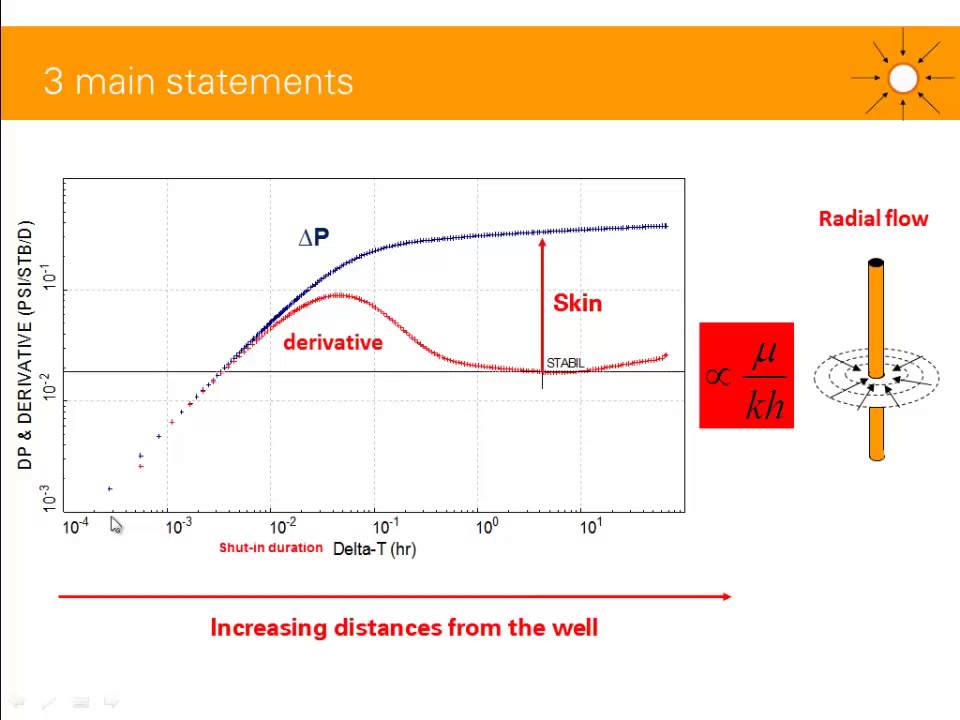
Log-log plot (or derivative plot) in well test analysis
Теги
derivative plotlog-log plotwell testwell test analysiswell test interpretationpressure transient analysiswell testing toolsradial flow regimeskin damagepermeabilitypressure build-uppressure build-up testPBU analysiswell testingwell test designPBU interpretationPBU designDST design and interpretationDST interpretationPFO analysistest wellformation evaluation toolspermeability testingreservoir engineeringpetroleum engineering


