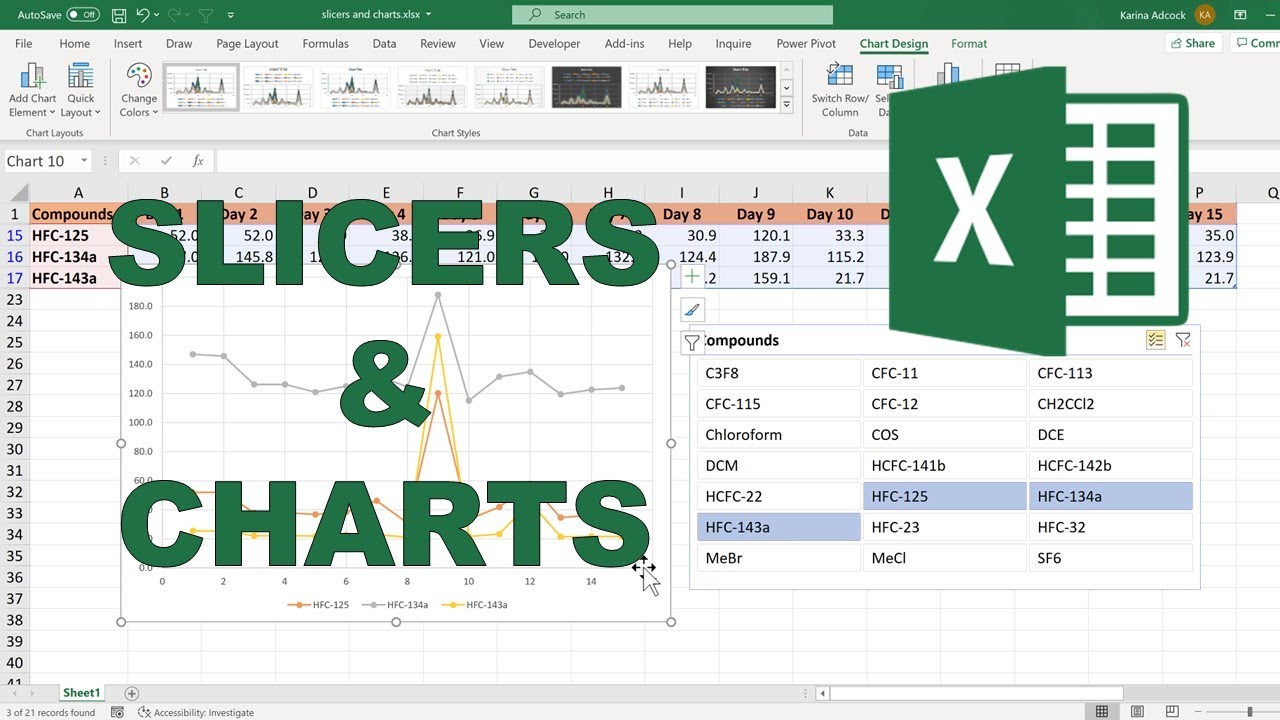
Convert the values into an excel table. Then on the 'Table Design' tab select 'Insert Slicer'. Make a chart for the whole of the table. Then you can use the slicer to filter the table and the chart.
---------------------------------------------------------------------------------
#exceltips #exceltutorials #excelcharts
SUBSCRIBE: [ Ссылка ]
Microsoft Office 365, 2016, Office Insider, Version 2001
These data are related to my PhD research
---------------------------------------------------------------------------------
IF YOU LIKED THIS VIDEO YOU MAY ALSO LIKE:
- How to make dynamic charts in excel [ Ссылка ]
- How to make a dynamic chart using data validation [ Ссылка ]
- How to create a dropdown box in excel [ Ссылка ]
How to make a dynamic chart using slicers in excel
Теги
excel dynamic chartshow to make dynamic charts in excelhow to link excel charts and slicersusing excel slicers with a tableexcel slicersslicers and chartsslicers and charts in excelmaking a dynamic chart using excel slicerslink excel slicers and chartsuse slicer with a chart in excelusing slicers with an excel tableusing slicers with tables in excelusing slicers with an excel chartslicer with a chart in excelexcel tutorial


![Парадокс «Гранд-отель» Гильберта [Veritasium]](https://i.ytimg.com/vi/7pKoCo_LmL8/mqdefault.jpg)