FREE Download this Chart from below link. Please SUBSCRIBE, Like, Comment and Share this video to your friends and family.
👆 Please Click this link to SUBSCRIBE: [ Ссылка ]
💾 Free Download Link:
Download Link 1: [ Ссылка ]
👩🏫 About Speedometer Chart:
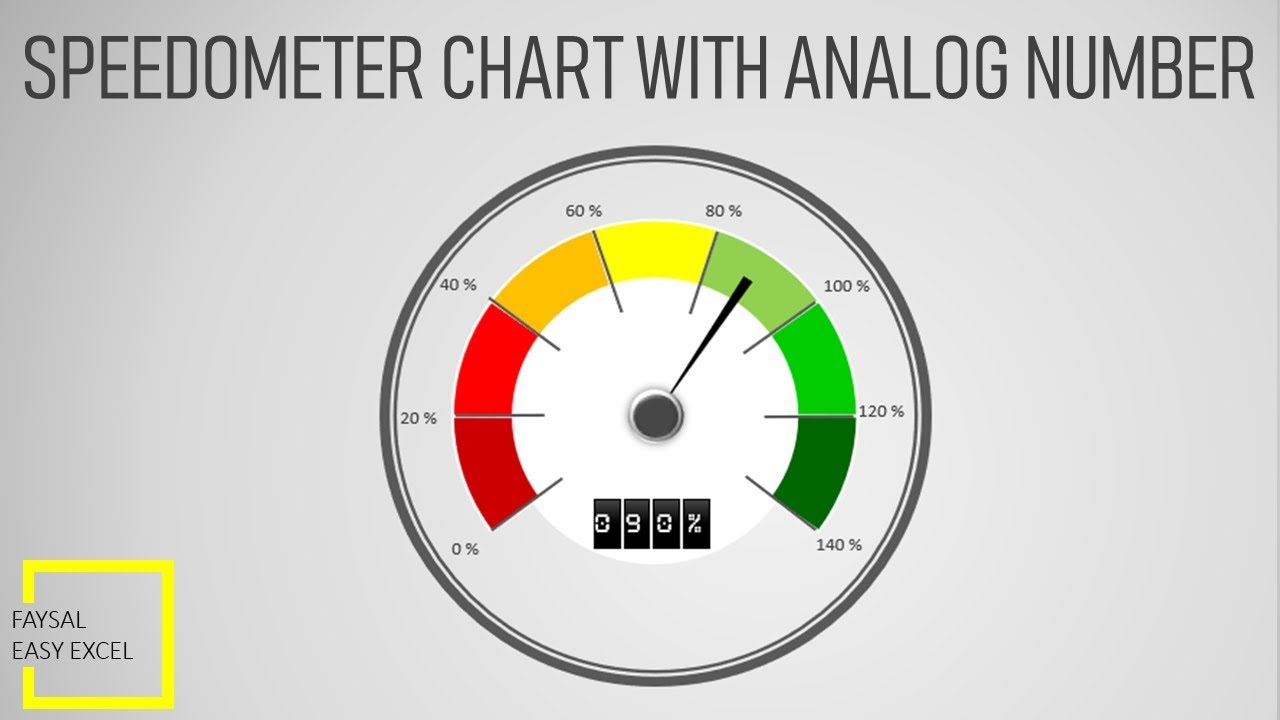
Speedometer Chart or Gauge Charts or Dial Chart save the day when it comes to comparing KPIs or business results against the stated goals. Excel’s massive bag of built-in visualization tools unfortunately has no ready-made solution to offer for such a chart. Hope you will like this chart.
✅ Join us:
YouTube: [ Ссылка ]
Blog: [ Ссылка ]
🎥 Watch our other videos:
1. Emojis in Excel: [ Ссылка ]
2. Excel Match function: [ Ссылка ]
3. Excel MID function: [ Ссылка ]
4. Add Zero before Numbers in Excel: [ Ссылка ]
5. Hide and Unhide Columns: [ Ссылка ]
6. Make a Drop-Down list: [ Ссылка ]
7. My Fiverr Excel Test: [ Ссылка ]
8. Daily Sales Trend Chart: [ Ссылка ]
9. Present vs Previous Sales: [ Ссылка ]
10. Mobile Phone Sales Dashboard: [ Ссылка ]
11. Smart Watch Sales Dashboard: [ Ссылка ]
12. Gauge Chart: [ Ссылка ]
13. Speedometer Chart: [ Ссылка ]
14. Metal Bar Chart: [ Ссылка ]
15. 2D Pencil Chart: [ Ссылка ]
16. Test Tube Chart: [ Ссылка ]
17. Pillar Chart: [ Ссылка ]
18. Pencil Bar Chart: [ Ссылка ]
19. Column Chart with background: [ Ссылка ]
20. Cylinder Chart: [ Ссылка ]
#SpeedometerChart #GaugeChart #FaysalEasyExcel
Create a Speedometer Chart with Analog Number in Excel 2016
Теги
create Speedometer Chart in excelhow to create speedometer Chart in excelgauge chart in excelspeedometer graph in excelinfographic charts in excelexcel speedometer chartgauge chartdial chartexcel 2016speedometer chartspeedometer chart in exceladvanced excel tricksexcel tips and tricksmicrosoft excelexcel for analystsexcel 2019dial chartsexcel dashboarddashboardgaugegauge chartsspeedometer graphmake a speedometer chart in excel


![🚀 СОЦИАЛЬНАЯ СЕТЬ + ЧАТ с нуля за 3 часа [Next.js 14 / React / Socket io / Strapi / TS]](https://s2.save4k.ru/pic/BwcznghxxHk/mqdefault.jpg)