Population standard deviation (or σ) measures how dispersed the data is with the population's mean. A low or small standard deviation indicates data are clustered tightly around the mean, and a high or large standard deviation suggests data are more spread out.
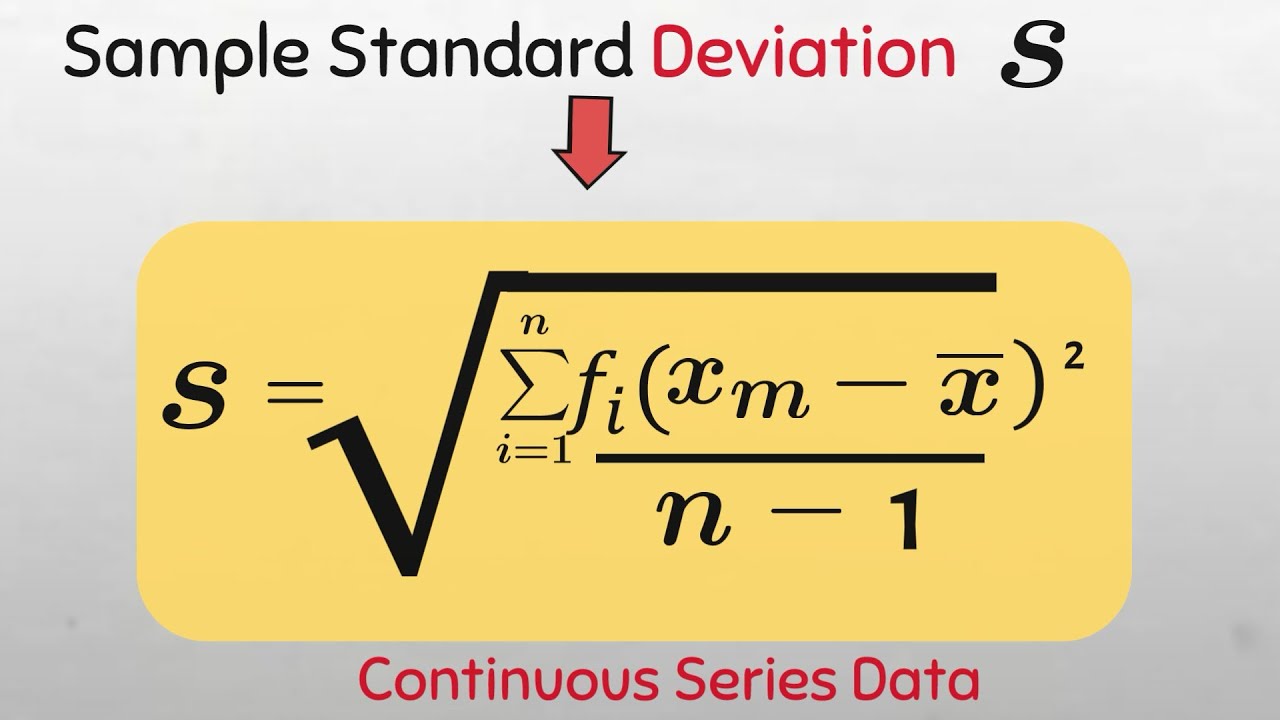
This is the formula for calculating the Standard Deviation of a population
Related videos
1. Find the Mean, Median, and Mode for INDIVIDUAL series [ Ссылка ]
2. Find the Mean, Median, and Mode for DISCRETE series
3. Find the Mean, Median, & Mode for CONTINUOUS series [ Ссылка ]
4. Find the Mean Deviation of ALL series Data [ Ссылка ]
5. Find the range for All series data [ Ссылка ]
6. Understanding statistical symbols: Sigma [ Ссылка ]
Subscribe to My other channels:
Stata: [ Ссылка ]
Biostatistics: [ Ссылка ]
Public Health: [ Ссылка ]
SPSS: [ Ссылка ]
EPI Info: [ Ссылка ]
#sigma #statistics #maths #centraltendency #education #medians #mean #arithmetic ##probability #educationalstatistics #statistics #mathematics #standard #standarddeviation #shorts