In this video, we'll cover the latest Zebra BI add-ins for Excel and PowerPoint. They will take your reporting and data analysis to a completely next level and make your life MUCH easier.
Tired of messy spreadsheets with bad visualizations?
It's time to make them a thing of the past. With Zebra BI for Office (Excel + PowerPoint) you can now present essential insights fast, saving yourself a ton of time and money.
Whether you're a business analyst, finance pro, BI ninja, occasional report creator, or just a reporting enthusiast, this webinar can help you:
- boost your Excel & PowerPoint reports with the new Zebra BI for Office
- discover the latest reporting best practices
- apply the newly acquired knowledge to your end-of-year reports – and impress everyone with your incredible skills!
00:00:00 Zebra BI for Office
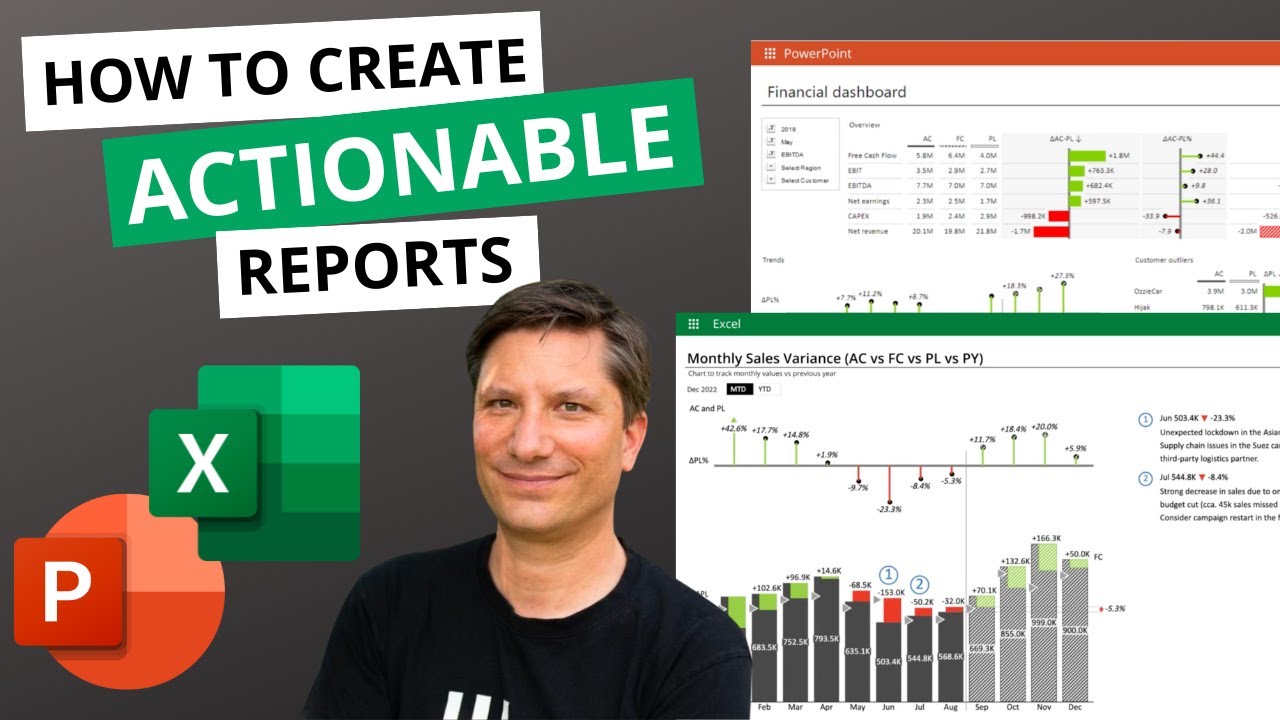
00:01:27 How to convert boring reports in Excel and PowerPoint
00:01:50 Key market trends in the data world
00:05:38 Problem with Excel
00:09:44 Zebra BI for Excel
00:54:42 Zebra BI for PowerPoint
01:01:30 Power BI + Office: Better together
💡 RESOURCES:
FREE Excel Templates to Start Using NOW: [ Ссылка ]
No more time spent on hacking #Excel to make the charts look good. Now with one click & boom! voilà! ⚡⚡ THANK YOU for developing this for the huge community of Excel users! - Carlos Barboza, Guerilla Data Analyst
Excel is still the #1 BI tool used for business reporting. A controversial statement, one would say.
But the reality is that Excel is everywhere. Flexibility, ease of use, and low entry barriers are just some of the benefits that are making Excel a ‘here-to-stay' tool.
However, for the most part, reports in spreadsheets or slides still don’t follow modern reporting best practices. This is not just a design problem, but it can actually cost you a lot of money if people don’t get the right business insights in seconds. This means you’re wasting their time (and, well, money).
Staying agile in uncertain times is crucial. Having a single source of truth across your entire stack (Power BI, Excel, and/or PowerPoint) can save hours of work, and advanced visualizations with additional context give you an immediate understanding of the performance.
This is what you’ll get by using Zebra BI for Office. With only one click you can unlock business insights instantly and deliver just the right information to everyone. The best part? You can do that either in Excel, PowerPoint, or Power BI. Transform your reporting and stay on top of your performance at all times.
👋 With Zebra BI for Office, you can transform your Excel and PowerPoint reports into professional, interactive visualizations that tell a story. And the best part? You don't need advanced BI skills to get started.
👉👉👉 Try Zebra BI for Office for free today and see just how simple it is to create charts that get results: [ Ссылка ] 👈👈👈
ABOUT OUR CHANNEL
Our channel is all about Actionable Reporting and has one goal: to enable everyone to create better reports. We cover Power BI, Excel, and PowerPoint reporting, business intelligence, business analytics, data storytelling, and related topics.
Check out our channel here:
[ Ссылка ]
Don’t forget to subscribe!
CHECK OUT OUR OTHER VIDEOS
[ Ссылка ]
[ Ссылка ]
[ Ссылка ]
We make these awesome data visualization tools, check them out here:
[ Ссылка ]
[ Ссылка ]
[ Ссылка ]
FIND US AT
[ Ссылка ]
GET IN TOUCH
Contact us on info@zebrabi.com
FOLLOW US ON SOCIAL
Get updates & reach out on our Social Media Profiles!
Twitter: [ Ссылка ]
Facebook: [ Ссылка ]
LinkedIn: [ Ссылка ]