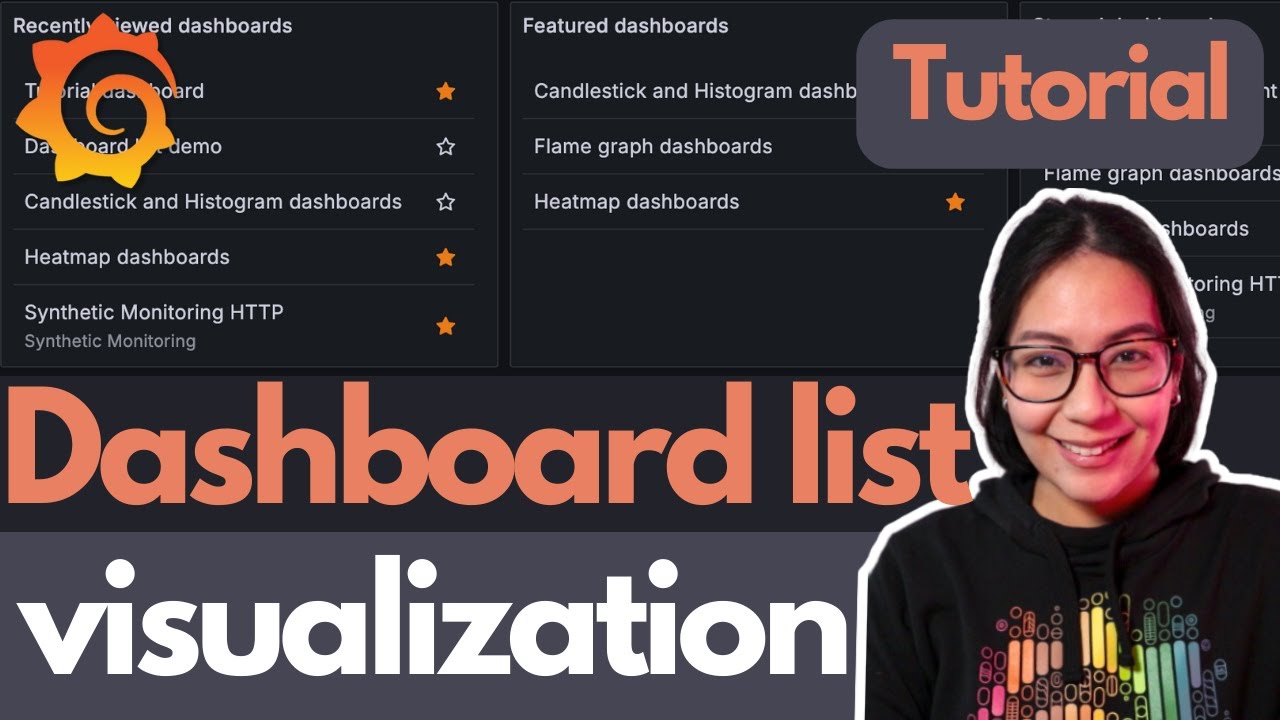
💡 Do you want to know what a dashboard list visualization is and how you can create one in Grafana?
Join Senior Developer Advocate Marie Cruz in this beginner-friendly tutorial to learn how dashboard list visualization works in Grafana.
Helpful links:
Dashboard list - [ Ссылка ]
Understanding dashboards in Grafana - [ Ссылка ]
☁️ Grafana Cloud is the easiest way to get started with Grafana dashboards, metrics, logs, and traces. Our forever-free tier includes access to 10k metrics, 50GB logs, 50GB traces and more. We also have plans for every use case. Sign up: [ Ссылка ]
❓ Have a question that isn't related to this video? Check out the Official Grafana Community Forums and ask your question or find your answer: [ Ссылка ]
-----
👍 If you found this video useful, be sure to give it a thumbs up and subscribe to our channel for more helpful Grafana videos.
📱 Follow us for the latest and greatest on all things Grafana and our other OSS projects.
X: [ Ссылка ]
LinkedIn: [ Ссылка ]
Facebook: [ Ссылка ]
#Grafana #Observability #BeginnersGuide #Visualization #DashboardList


![Junsun [Tiaiwait] D100 GPS Navigation flash firmware.](https://i.ytimg.com/vi/vfJI1NQO7fI/mqdefault.jpg)


![Страшные истории на ночь ЗАЙЧИК ПРОСИЛ ПЕРЕДАТЬ (18+) Ужасы Мистика Истории из жизни [ КРИПИПАСТОР ]](https://i.ytimg.com/vi/x9LG03_8L5E/mqdefault.jpg)


