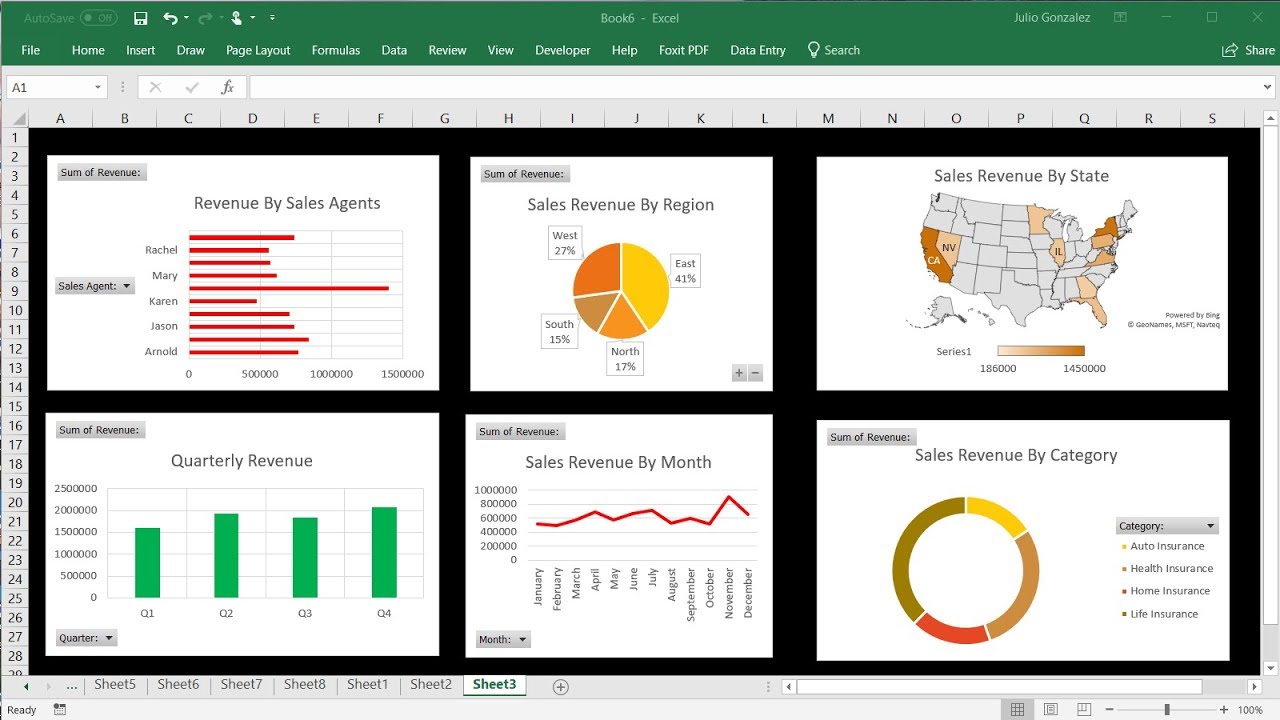
This video tutorial provides a basic introduction into pivot tables, charts, slicers, and interactive excel dashboards. It explains how to simplify a large source data file with pivot tables and visually represent it with Pivot Charts in Excel 2016 such as Bar Graphs, Column Charts, Line Graphs, Pie Charts, Doughnut Charts, and Map Charts.
Excel Tutorial For Beginners:
[ Ссылка ]
Top 30 Excel Tips & Shortcuts:
[ Ссылка ]
________________________________________
How To Look Up Customer Data In Excel:
[ Ссылка ]
Excel Vlookup Function:
[ Ссылка ]
How To Create a Data Entry Form In Excel:
[ Ссылка ]
Multiple Dependent Drop Down Lists:
[ Ссылка ]
How To Show & Hide Formulas:
[ Ссылка ]
______________________________________
Relative & Absolute Cell References:
[ Ссылка ]
Lock Cells and Protect Sheets In Excel:
[ Ссылка ]
Excel Interactive Checklist:
[ Ссылка ]
Excel Pivot Tables:
[ Ссылка ]
______________________________________
YouTube Channel Growth Accelerator:
[ Ссылка ]
Final Exams and Video Playlists:
[ Ссылка ]
Full-Length Math & Science Videos:
[ Ссылка ]


![[79/155] #ЩАСПРОЧТУ. Скорочтение за 90 дней. День 46. Занятие 14](http://i.ytimg.com/vi/FTQ6z3f9XoE/mqdefault.jpg)


![Сила позитивного мышления. Норман Винсент Пил. [Аудиокнига]](https://i.ytimg.com/vi/EgCY-4DmlWw/mqdefault.jpg)