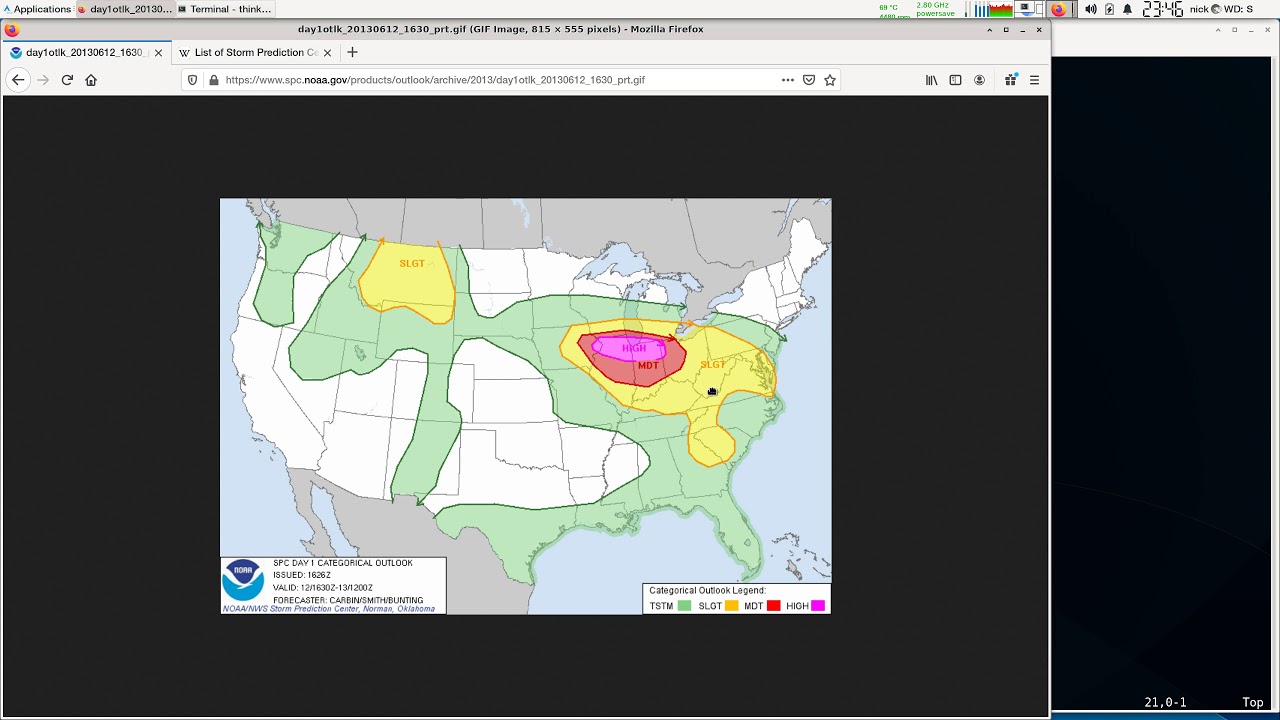
I attempt to explain a script i wrote a few months ago for automatically interpreting the convective outlook maps. This is the script: [ Ссылка ] The weather.gov site for the local offices has an API which makes it easier to get data without having to do stuff like this, but I am unsure if the storm prediction center site has an API. If it does then all this is pretty much in vain. But it was still interesting to do. Also I didn’t mention the -5 +5 stuff when checking for the category/probability colour values. That is basically just tolerance values. It will identify the colour even if one or more of the RGB values is slightly off.


![Late 2009 iMac 27" Video Card Repair [4850 Bake]](http://i.ytimg.com/vi/v1DXBLkiqFM/mqdefault.jpg)