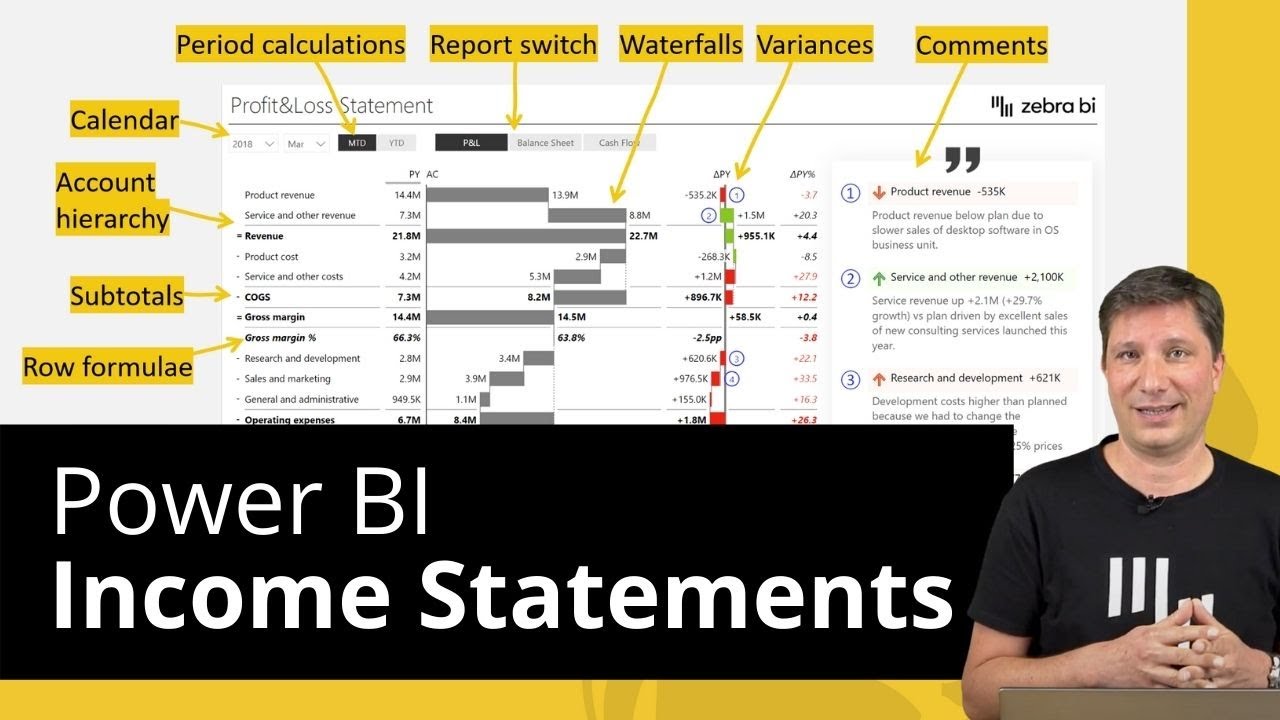
Income Statements (Profit & Loss) in Power BI
A perfect financial report? In this step-by-step tutorial, you'll learn top tips&tricks to structure, create, and design understandable and actionable income statements in Power BI with the help of Zebra BI visuals.
An income statement (or a Profit & Loss statement) is one of the three key financial reports, along with a balance sheet and cash-flow statement.
Still, creating income statements in MS Power BI can be nightmarishly difficult. Datasets are hierarchical, containing several intermediate results and subtotals, consist of both “good” and “bad” elements (e.g. revenues vs expenses), requires inserting additional performance indicators (e.g. percentages like Gross Margin in %, Operating income as % of Revenue), etc.
✅ Subscribe to always get our latest videos: [ Ссылка ]
In this video you'll learn:
👉Hierarchical (multi-level) income statements
👉Managing subtotals and intermediate results
👉How to manage ragged hierarchies
👉Adding KPIs via row-level formulas
👉Commenting on individual accounts
👉Multidimensional income statements (by business unit, legal entity, etc.)
(0:00) - Introduction by Andrej Lapajne
(0:50) - P&L example presentation
(5:47) – Agenda
(6:45) – Anatomy of a financial report
(11:51) – Financial data model and data preparation
(25:10) – Building a report
(29:58) – Inverted rows
(32:50) – Row Formulae
(36:12) – Creating a report slicer to switch between reports
(38:48) – Comments & Comment markers
(42:15) – KPI Trends
(55:25) – Bridge Charts
(57:50) – Wrapping up
(01:00:12) – Q&A Session
To try the examples yourself:
1. Download and install our complimentary free trial of Zebra BI visuals for Power BI
2. Unzip the file with examples and open them in Power BI
=========================================================
Download Zebra BI visuals for Power BI free: [ Ссылка ]
=========================================================
👋 With Zebra BI you can transform your Power BI reports into professional, interactive visualizations that tell a story. And the best part? You don't need advanced BI skills to get started.
👉👉👉 Try Zebra BI for Power BI for free today and see just how simple it is to create charts that get results: [ Ссылка ] 👈👈👈
ABOUT OUR CHANNEL
Our channel is all about Actionable Reporting and has one goal: to enable everyone to create better reports. We cover Power BI, Excel, and PowerPoint reporting, business intelligence, business analytics, data storytelling, and related topics.
Check out our channel here:
[ Ссылка ]
Don’t forget to subscribe!
CHECK OUT OUR OTHER VIDEOS
[ Ссылка ]
[ Ссылка ]
[ Ссылка ]
We make these awesome data visualization tools, check them out here:
[ Ссылка ]
[ Ссылка ]
[ Ссылка ]
FIND US AT
[ Ссылка ]
GET IN TOUCH
Contact us on info@zebrabi.com
FOLLOW US ON SOCIAL
Get updates & reach out on our Social Media Profiles!
Twitter: [ Ссылка ]
Facebook: [ Ссылка ]
LinkedIn: [ Ссылка ]


![[Оригинал] Начальная и конечная заставка "Индустрия 2.0" (Россия 24, 2012)](http://i.ytimg.com/vi/dknAzGhy510/mqdefault.jpg)