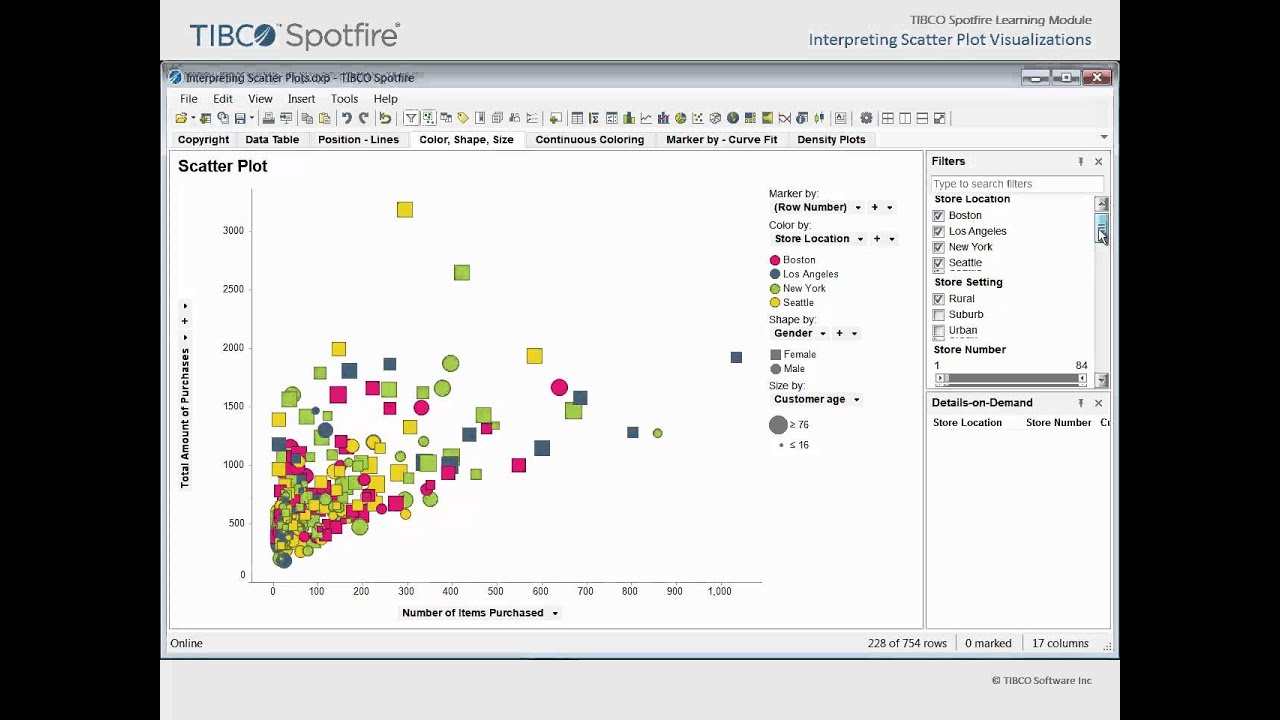
Interpreting Scatter Plot Visualizations: Learn how to interpret data presented in scatter plot visualizations; Consider scatter plot visualization configuration options which may not be intuitive. This video is current as of Spotfire 6.5. Some interactive features in the original video are not available in YouTube. The original is available here: [ Ссылка ] (Click "Login as guest" to access that link if needed)


![МЕРКУРИЙ, А НЕ ВЕНЕРА ЯВЛЯЕТСЯ БЛИЖАЙШЕЙ ПЛАНЕТОЙ К ЗЕМЛЕ [Орбиты планет]](https://i.ytimg.com/vi/r0EJY4ubBoU/mqdefault.jpg)


![Секрет хорошего отпуска [Veritasium]](https://i.ytimg.com/vi/JIMx6cE-r94/mqdefault.jpg)


![ИНОПЛАНЕТНЫЕ ИЕРОГЛИФЫ [Топ Сикрет]](https://i.ytimg.com/vi/2MjR7WW-e6E/mqdefault.jpg)


