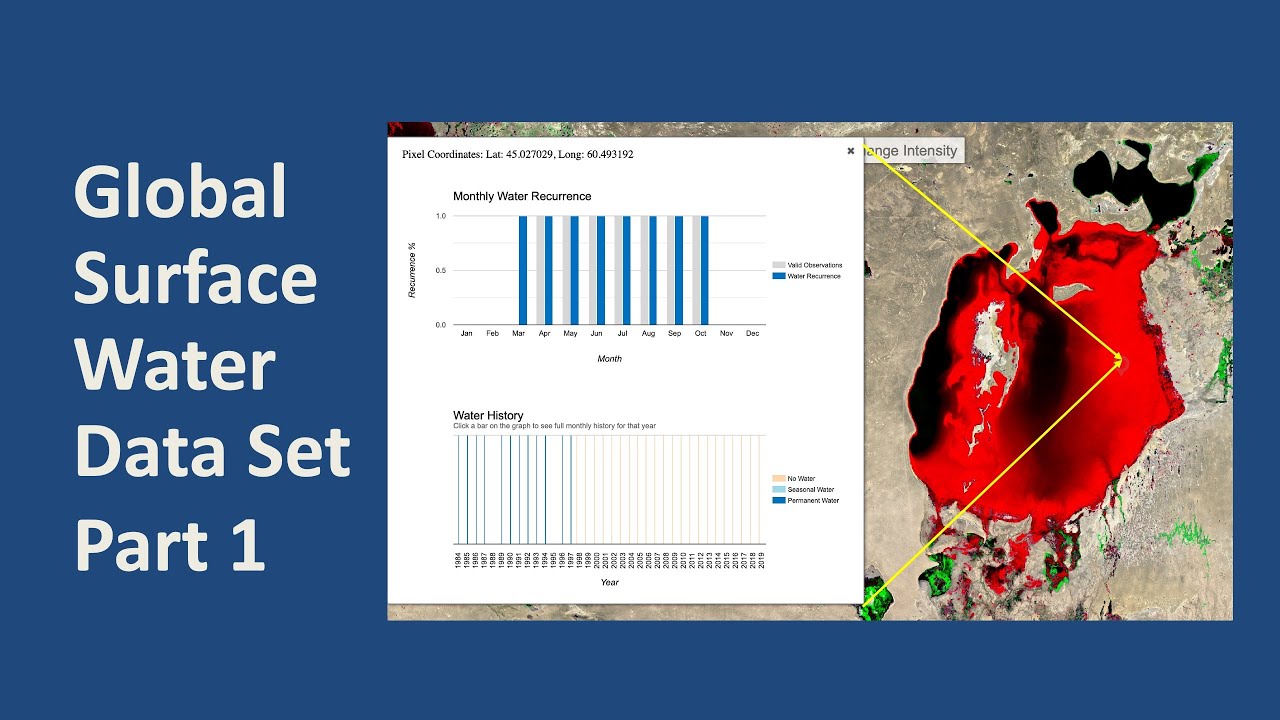
In this video, we will look at the free Global Surface Water Data Set provided by the Joint Research Centre of the European Commission and Google. We will have a look at the different thematic maps that it can produce, to see how the Aral Sea has dried up since 1984.
Then we will use it to ask some interesting questions like:
1) When did the Salma reservoir in Afghanistan fill up with water?
2) Is the Kajaki reservoir in Afghanistan silting up?
3) Are the Hamun wetlands on the Iran / Afghanistan border drying up?
This video is part of the online QGIS 101 training course. In the next video we will look at how to download the data, and use it in QGIS to make our own maps.
Link to JRC website: [ Ссылка ]
Link to maps used in this video: [ Ссылка ]
Attribution of photos used in this video:
Kajaki Dam:
[ Ссылка ]
Flamingos in Hamun wetland:
[ Ссылка ]
Dry Hamun Lake: [ Ссылка ]
QGIS 101: Global Surface Water Data Set - Part 1
Теги
Andreas de Jongonline learningQGISQGIS 101Salma DamKajaki damAfghanistanIranHari-rodHelmandHelmand river basinHarirod river basinHarirudGlobal Surface Water Data SetWater OccurrenceWater Occurrence Change IntensityWater SeasonalityAnnual Water RecurrenceWater TransitionsMonitoring of reservoirsMonitoring of wetlandsMaximum Water ExtentHamun wetlandsLandsatGoogleGoogle Earthwater resources managementIWRM