For more information on how to achieve customer 360 with graph visualization, see our website: [ Ссылка ]
Successful businesses understand their customers. Accurate customer 360 insight leads to decreased churn, increased customer value, better planning and increased profits.
This webinar, co-presented with our partners at Expero, explores how graph visualization can help you achieve a single definitive view of the customer.
You’ll learn how graph technologies are used to connect customer touch-points and create a better, more profitable customer journey. We’ll share examples to show how you can generate customer insights that improve loyalty, decrease churn and maximise your ROI.
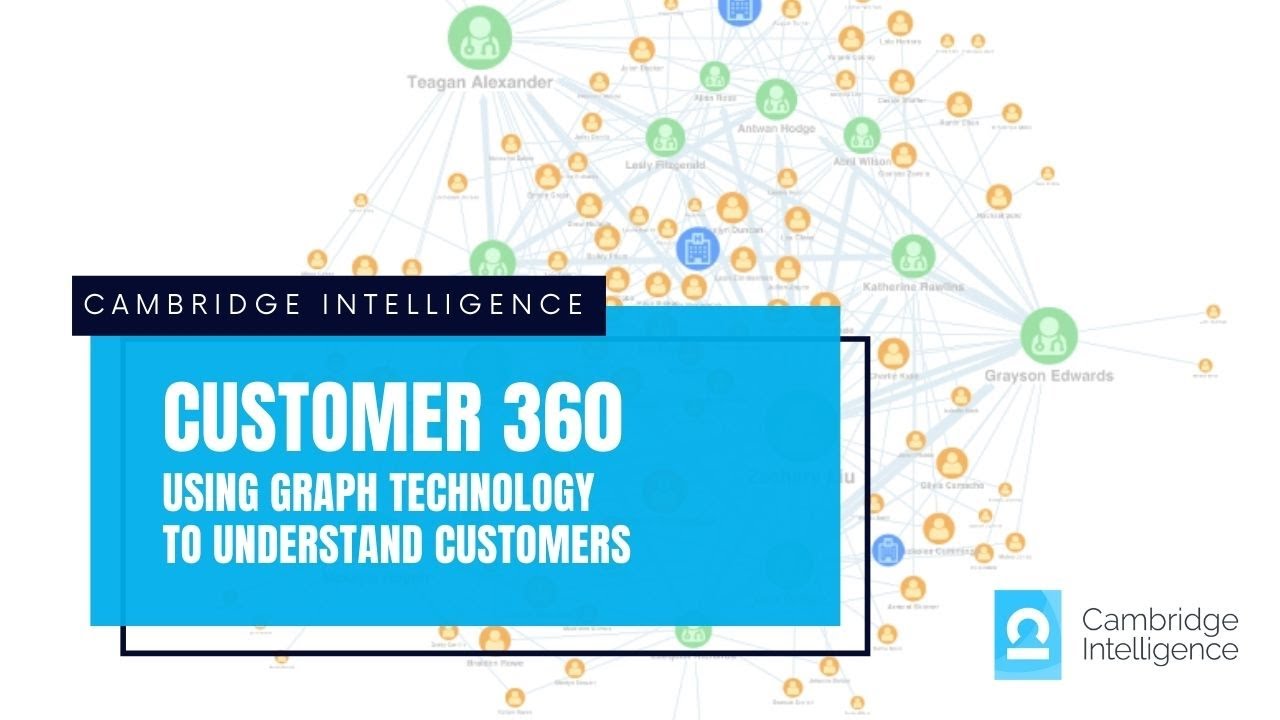
What is Customer 360?
Customer 360 is about collecting, collating and aggregating customer data into a single view, revealing valuable business insight.
Customer 360 visualization for customer-facing agents
Whether it’s to identify the best next action, understand historical context or find an up-sell opportunity, employees on the frontline need fast and clear customer insight.
There’s a bewildering volume of data available to them, and speed is critical. Presenting information as intuitive visualizations built into existing customer relationship management (CRM) tools, agents can join the dots and make the right decisions, quickly.
Strategic planning with Customer 360
Where customer-facing agents use insight to manage specific interactions, business leaders turn to Customer 360 views to uncover, understand and predict business trends.
This audience needs a view of many different customers simultaneously. When they understand aggregated data they can see correlations in behavior, make predictions to reduce risks, and uncover opportunities to exploit.
Custom-built Customer 360 visualization tools
At Cambridge Intelligence, we’ve helped organizations including Barclays, CGI, and First Republic Bank to build powerful Customer 360 visualization tools.
Using our graph visualization and timeline visualization technologies, it’s quick and simple to design interactive visualizations that look great and integrate seamlessly with your existing tools and workflows.
#customer360 #graphvisualization #KeyLines