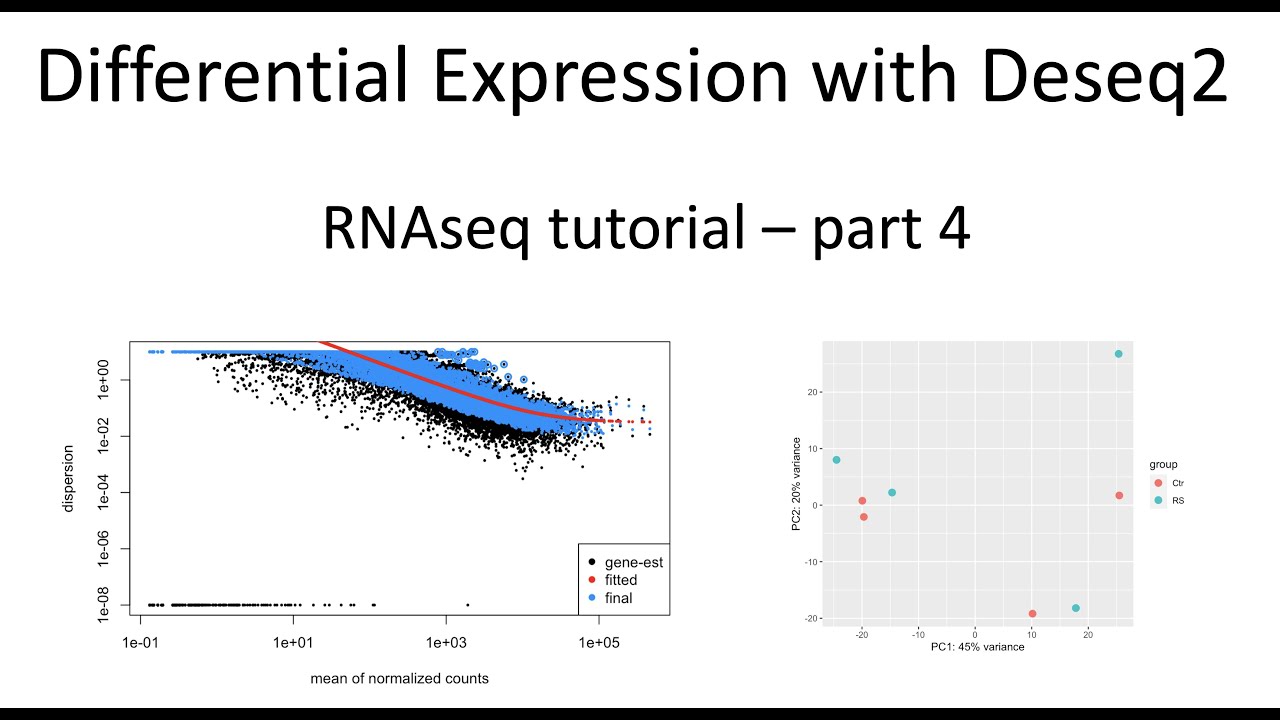
Here I use Deseq2 to perform differential gene expression analysis. I used a count table as input and I output a table of significantly differentially expressed genes. I also show PCA and dispersion QC of the RNAseq data.
The output data can be further manipulated and explored in R, python, or excel. E.g., you can extract positively enriched genes and sort by log-fold change. You can also use the Ensemble identifiers in gene ontology analysis directly. However, in future videos I will show the conversion of Ensemble IDs to gene symbol and show how to create heatmaps and other useful figures.
The samples include normal human cell control and replicative senescence cells from NCBI accession GSE171663
Deseq2 citation:
Love MI, Huber W, Anders S. Moderated estimation of fold change and dispersion for RNA-seq data with DESeq2. Genome Biol. 2014;15(12):550. doi: 10.1186/s13059-014-0550-8. PMID: 25516281; PMCID: PMC4302049.


![[4K] AI ART Lookbook Model Al Art video | Visiting Le Sirenuse, Positano](http://i.ytimg.com/vi/1fELvHt9mB8/mqdefault.jpg)


![FREE rotate your phone animation [HD]](https://i.ytimg.com/vi/_VHtJZxQJR0/mqdefault.jpg)